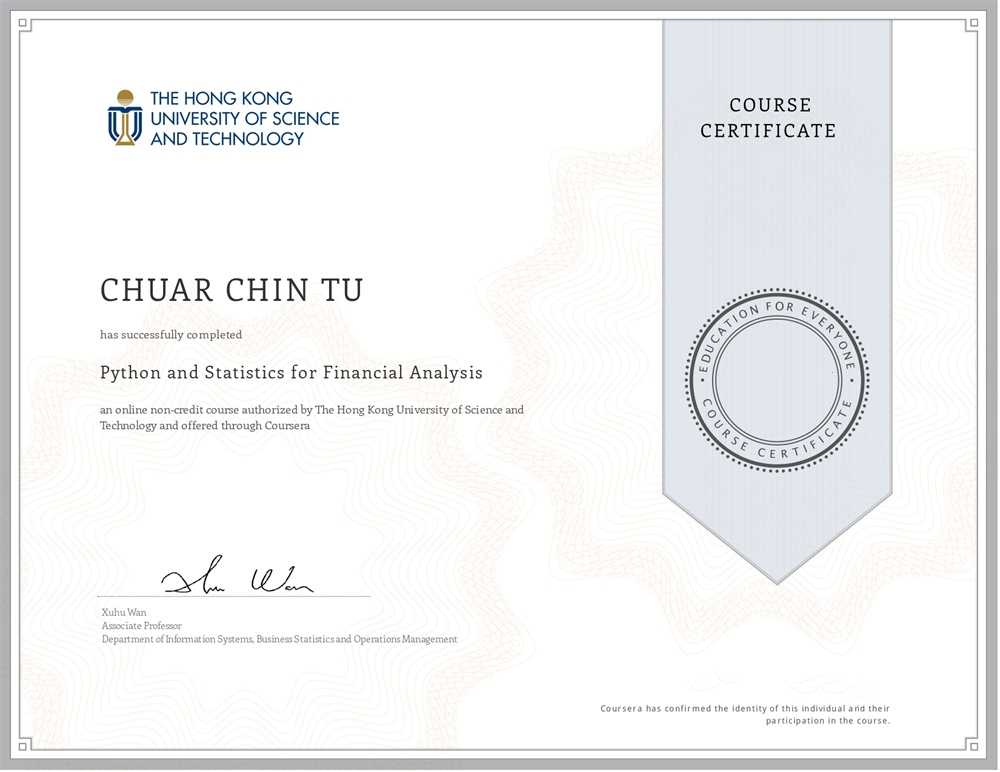
Eric Chuar has completed the Python and Statistics for Financial Analysis for Personal & Professional Productivity and received a certificate from The Hong Kong University of Science and Technology.
SCHOOL:
The Hong Kong University of Science and Technology
GRADUATED:
2018
DURATION:
6 Months

Python and Statistics for Financial Analysis Skills Gained
learn basic python to import, manipulate and visualize stock data in this module.
Explore basic concepts of random variables. Understanding the frequency and distribution of random variables, we extend further to the discussion of probability.
Understand the basic concept of statistical inference such as population, samples and random sampling.
Learning the association of random variables to simple and multiple linear regression model.
Course Perspective
Just wrapped up the “Python and Statistics for Financial Analysis” course, and let me tell you, it was an eye-opener. I’ve always been the kind of person who likes to get my hands dirty with the material before I even step into a formal learning setting. Sure, a certificate is nice, but the real deal is applying what you’ve learned, right?
Stock Data and Python: One of the first things that hit me was how Python could be used to mess around with stock data. Importing, manipulating, and even visualizing stock trends was like a magic show but with data. I can totally see myself using this in digital marketing analytics, even though it’s financial data we’re talking about.
Playing with Random Variables: We got into random variables and their frequency and distribution. It’s like going behind the scenes of a dice roll. Random variables are everywhere, from the stock market to consumer behavior. And you bet I’m going to use this in my marketing strategies to better understand customer actions.
Statistical Inference: Learning about populations and samples was cool. I mean, we make assumptions and predictions all the time in digital marketing, so understanding the basics of statistical inference could really help in making those educated guesses more, well, educated.
Regression Models: Linear regression models were the cherry on top. It’s like understanding the relationships between different variables. For example, how does the price of one stock affect another? Or in my case, how does a particular marketing strategy impact consumer behavior?
So, here’s the plan: I’m taking all this newfound knowledge and sharing it. Whether it’s digital marketing or anything else I’m into, I’m all about that community learning life. I’ve got more years behind me than ahead, and a family and kid to think about. So why not make the most of it and help others along the way? Especially in Malaysia and Singapore, places I can’t help but love. Time to blend some financial analysis into my digital marketing magic. Let’s go!
