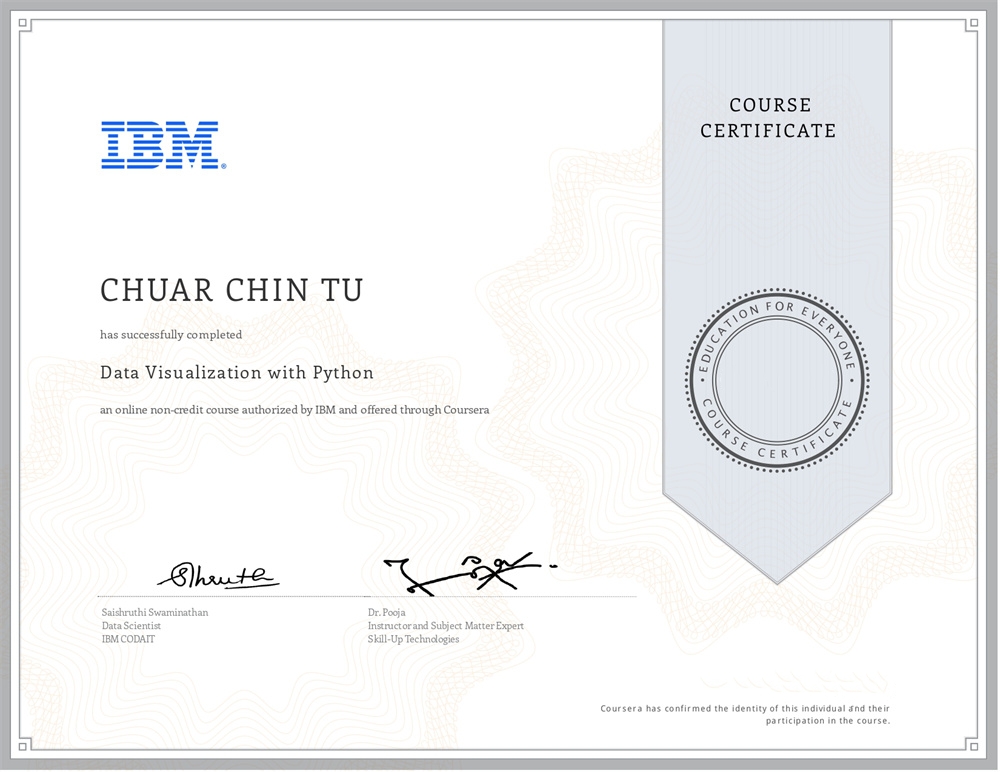
Eric Chuar has successfully certified and completed Data Visualization with Python Certificate from IBM.
SCHOOL:
IBM
GRADUATED:
2017
DURATION:
6 Months

Data Visualization Skills Gained
Implement data visualization techniques and plots using Python libraries, such as Matplotlib, Seaborn, and Folium to tell a stimulating story
Create advanced visualizations such as waffle charts, word clouds, regression plots, maps with markers, & choropleth maps
Create different types of charts and plots such as line, area, histograms, bar, pie, box, scatter, and bubble
Generate interactive dashboards containing scatter, line, bar, bubble, pie, and sunburst charts using the Dash framework and Plotly library
Course Perspective
Just finished the Data Visualization with Python course and, man, was it an eye-opener. I’ve always been the kind to get my hands dirty before jumping into any course, especially certifications. Let’s be real, certifications might impress some people, but it’s your skills that do the talking, right?
The course took me through the ropes of Python libraries like Matplotlib, Seaborn, and Folium. We’re talking about turning raw data into something visually appealing and informative. In my line of work—digital marketing and programming—visualizing data can really set you apart. People understand pictures way better than a spreadsheet, trust me.
I learned how to create all sorts of charts—line, area, histograms, you name it. But it’s not just about making things look pretty; it’s about telling a story. The course even went into advanced stuff like waffle charts and word clouds. And those regression plots? They’re game-changers for understanding trends and making predictions.
Now, the interactive dashboards were the cherry on top. Using the Dash framework and Plotly library, I can now create interactive visuals like scatter, line, bar, and even sunburst charts. These aren’t just static images; they’re visuals you can interact with, which is super useful for presentations or live discussions.
I’ve been in Malaysia and Singapore for years, and I’m all about sharing what I know. Whether it’s digital marketing, programming, or any of my other interests like badminton and red wine, I love to share my knowledge. Got a family and a kid to look out for, and life’s too short to hoard what you know.
So yeah, this course? Absolutely valuable. It’s not just about the technical know-how; it’s about effectively communicating complex data in a way anyone can understand. That’s a skill that’ll serve me well in my career and beyond, and one that I’m eager to share with others.
